Understanding Colony Buildup and Decline: Part 5 – Egglaying, Adult Survivorship, and Modeling Colony Growth
Understanding Colony Buildup and Decline – Part 5
Egglaying, Adult Survivorship, and Modeling Colony Growth
Randy Oliver
ScientificBeekeeping.com
First Published in ABJ in June 2015
CONTENTS
Some Questions Begging For Answers
Survivorship Of The Workers
A Simplified Mathematical Model
Question: Why Does The Population Stop Growing After 10 Weeks?
Population Top Out
Playing Catch Up
Next
Acknowledgements
Citations and Footnotes
I could wax poetic about the wonder of the honey bee superorganism, but when it comes to making management decisions, it is more informative to use a reductionist approach to understand why to do what. In the case of colony buildup, this means studying the math of recruitment vs. attrition. So let’s do the math!
I left off during the linear growth phase of the colony (following the spring turnover) with several unanswered questions:
Some Questions Begging For Answers
- To what extent does a queen’s pace of egglaying vary over the course of a season?
- Why does it seem to take only 6-10 weeks to reach maximum colony population?
- What determines the maximum size to which a colony will grow?
- Why can weak colonies sometimes catch up with those that got a head start?
- And why does the population stop growing after 10 weeks?
So let’s see if we can find answers to each of these questions in turn:
Question: To what extent does a queen’s pace of egglaying vary over the course of a season?
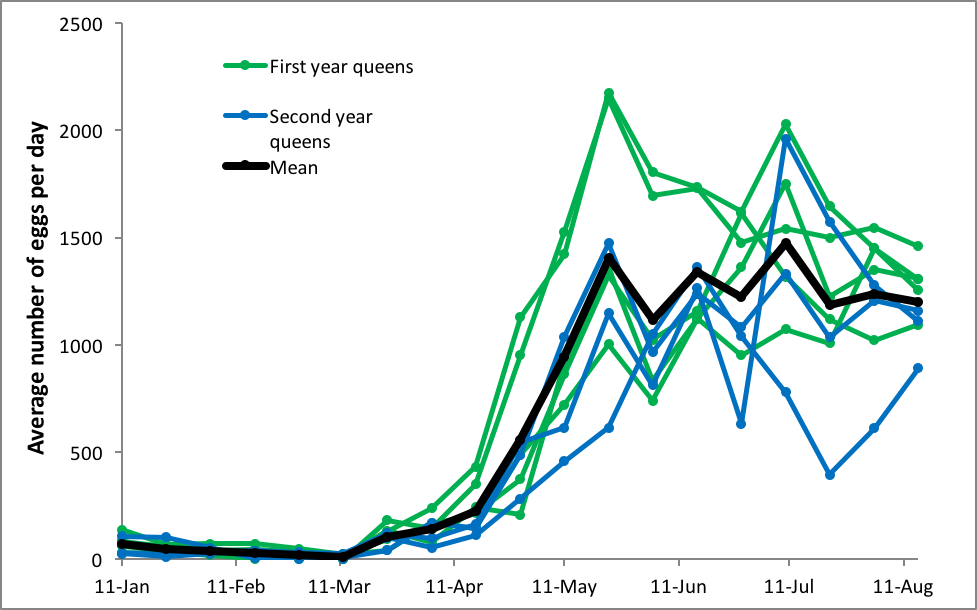
In order to answer this question, we’d need regular measurements of the amount of sealed brood in a number of colonies over the course of the season. And again, Lloyd Harris’ data provides us with that information. I plotted out his measurements for established colonies in their second year, five of which had been requeened the previous July, and three of which had queens in their second year (Fig. 1).
Figure 1. Average rates of egglaying [[i]] for 8 different queens in overwintered colonies over each 12-day time period in the spring of 1977 in Manitoba. In these two groups of hives, the queens tended to rapidly ramp up their egglaying as the colonies expanded their broodnests in April and May, tending to peak in mid May, and then settle back down a bit afterward.
[i] Specifically, the amount of sealed brood, which underestimates the actual rate of egglaying.
In answer to our question, Harris’ queens hit peak egglaying early in the season (young queens exhibiting the higher rates), and then tended to level off at a lower rate (although still at nearly an egg a minute, 24 hrs a day). The hiccups in brood production appeared to be related to crowding of the broodnests during nectar flows (and then bursts of egglaying as the cells were cleared). The swarm impulse didn’t occur until July.
Practical application: as far as management for maximum egg production, there are four main things that the beekeeper can do: (1) protect the hive from cold, (2) keep young queens, (3) manage the broodnests to avoid restriction of the queen’s ability to find a place to lay (this could involve reversing the supers, or rearranging or adding drawn comb), and (4) feeding during times of dearth or poor weather.
Scientific Notes:
Scientists typically present the results of their studies as mean (average) values for each test group, but means alone may mean little. When you look at graphs showing means (averages), be sure to look at the error bars (usually the standard error of the mean—SEM) which is an indication of how much variation there was relative to the size of the group. If the error bars are large relative to the differences in means between the test groups, then the reader may want to ask what was the cause of that variability.
The human brain is far better at detecting patterns in pictures rather than in columns of numbers. For this reason, my readers may notice that I tend to favor showing raw data in graphical form for each individual colony, in order to let you use their own eyes to see the degree of variation from colony to colony, yet at the same time to look for patterns or trends.
Another frequently misunderstood term is “significance,” which the lay reader may confuse with meaning “substantial” or “meaningful.” This is often not the case. A scientist can’t say that there was any difference between the results from two test groups unless it was “significantly different” from that which would be expected to occur due to random variation—this is called statistical significance. But statistical significance may not have much practical application.
As a hypothetical example, imagine a study in which a researcher treated 1000 hives with a test substance (also running 1000 control hives). Imagine that the result was that the test substance appeared to increase mean honey production in the test group by 1 ounce per hive. Due to the large “n” (number of hives), that result might allow the researcher to state that “feeding the product significantly increased honey production.” But few beekeepers would get too excited about a product that increased per-hive productivity by only an ounce—in this case the results might be significant statistically, but insignificant practically.
On another subject, in this series I’m drawing heavily upon Lloyd Harris’ exemplary data set. But one must be cautious about extrapolating general principles based upon a single data set. Keeping this in mind, I’ve compared Harris’ data to that of many others, both historical and recent, and feel that it is indeed representative.
Now that we have good estimates for the range of rates of egglaying, we can calculate the total recruitment of new workers over any period of time. For example, simple math shows that at the rate of say 1200 eggs per day, a colony’s total recruitment over 6 – 10 weeks will result in an additional 60,400 – 84,000 workers. But from this we must then subtract the attrition of aged or worn out workers. In order to calculate this, we must understand the expected survivorship of those workers.
Survivorship Of The Workers
As recently pointed out by my friend Peter Borst [2], beekeepers have long speculated about how long a worker honey bee lives, but it wasn’t until the advent of good marking paints that this question began to be answered with hard data.
Worker survivorship is well reviewed by Woyke [3], who found that:
- Workers’ lives appear to be shortened by the amount of broodrearing that they do.
- An intense honey flow can also shorten their lives.
- Measured mean worker lifespans (by various researchers) varied from 16.6 to 37.6 days, perhaps averaging (during the productive season) about 30 days.
- Woyke also noted that despite high brood production, under unfavorable conditions colonies may not reach populations exceeding 30,000 bees.
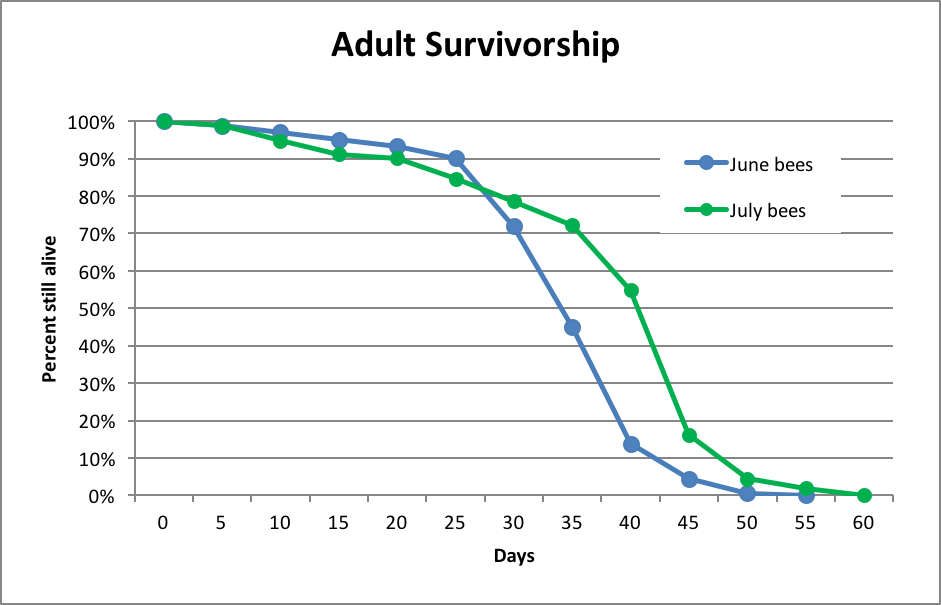
This information is useful, but we need to know more than the simple estimate of average worker longevity. What we really need to know is the day-by-day rate of attrition of any cohort of bees at various times of the year. Few researchers have dedicated serious time to finding the answer to this question. One of the best data sets is that of Sakagami and Fukuda [4] (Fig. 2).
Figure 2. Worker bee survivorship of Italian-type bees in Japan, after Sakagami (1968). The main honey flow (clover) occurs in June, and appeared to shorten the lives of workers due to increased foraging.
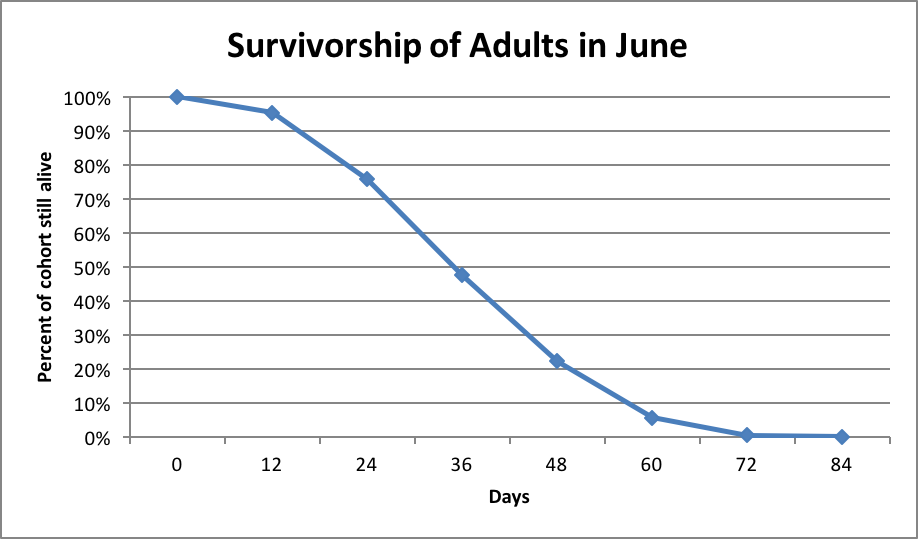
Let’s now compare the above to Lloyd Harris’ even more extensive data from Manitoba a decade later (Fig. 3):
Figure 3. Worker bee survivorship of Italian-type bees in Manitoba, after Harris [[i]; raw data courtesy the author]. Note how remarkably similar were the survivorship curves for Italian-type workers during June in either Japan or Manitoba. Harris found this survivorship curve to be consistent from April through August.
[i] Harris, JL (2010) The effect of requeening in late July on honey bee colony development on the Northern Great Plains of North America after removal from an indoor winter storage facility. Journal of Apicultural Research and Bee World 49(2): 159-169.
These data sets strongly suggest that worker survivorship is relatively constant over the course of the summer. So we now know how much attrition to subtract from recruitment. Let’s go back to the math!
A Simplified Mathematical Model
Question: Why does it seem to take a colony only 6-10 weeks to reach maximum population?
Question: And then why does the population seem to stop growing after 10 weeks?
In order to attempt to answer the above questions, I created the simple Excel spreadsheet shown in Table 1. In the yellow cells, I can enter the initial starting population of adult bees, and also the number of adults emerging per day (I used the term “eggs per day” since it better reflects the influence of the queen [6]). And then, applying Harris’ percentages of surviving bees at each 12-day time point (thanks to Lloyd for sharing his original data), I had the spreadsheet calculate the number of bees in each 12-day age cohort still expected to be alive at each future time point. Then I simply added each column in order to obtain the total colony population at each time point.
| 10,000 | Starting population of adult bees | ||||||||
| 1000 | Eggs per day 12 days previous | ||||||||
| 12,000 | Amt sealed brood 12 days previous | ||||||||
| Day | 0 | 12 | 24 | 36 | 48 | 60 | 72 | 84 | 96 |
| 0 | 10,000 | 9,523 | 7,574 | 4,756 | 2,219 | 562 | 47 | 1 | 0 |
| 12 | 12,000 | 11,424 | 9,204 | 5,700 | 2,664 | 672 | 56 | 1 | |
| 24 | 12,000 | 11,424 | 9,204 | 5,700 | 2,664 | 672 | 56 | ||
| 36 | 12,000 | 11,424 | 9,204 | 5,700 | 2,664 | 672 | |||
| 48 | 12,000 | 11,424 | 9,204 | 5,700 | 2,664 | ||||
| 60 | 12,000 | 11,424 | 9,204 | 5,700 | |||||
| 72 | 12,000 | 11,424 | 9,204 | ||||||
| 84 | 12,000 | 11,424 | |||||||
| 96 | 12,000 | ||||||||
| Total | 10,000 | 21,535 | 31,022 | 37,420 | 40,595 | 41,614 | 41,783 | 41,806 | 41,818 |
Table 1. Calculation of colony buildup over time based upon the queen’s egglaying rate and Lloyd Harris’ adult survivability curve. Illustrated is an example for a colony starting at 10,000 bees, with a queen laying 1000 eggs per day. Note that at about 60 days the birth rate and death rate reach equilibrium, and the colony essentially stops growing.
What struck me when I created this spreadsheet is that the rate of recruitment and the rate of attrition consistently reach equilibrium at about 60 days after the broodnest is fully established. Think about it– assuming that the queen’s rate of egglaying remains constant, but that the adult population continues to grow, then at some point the daily rate of attrition of the increasing adult population will match the daily rate of recruitment. At that point, the birth rate and the death rate reach equilibrium, and will remain so until either the birth rate or death rate changes.
But wait, you say, what about the influence of the starting population? Of course, a colony with a larger initial broodnest (such as a strong overwintered hive) gets a jump start, and can grow to its maximum in about 6 weeks (42 days). But the interesting thing is that after 10 weeks (70 days) of normal attrition, there are only a negligible amount of bees remaining from any initial adult population, meaning that the size of any starting population is irrelevant by that time.
Practical application: Surprise, surprise—the colony reaches maximum population at about 60 days after the broodnest is fully established—in agreement with the common beekeeper experience that it takes about 6 weeks for an overwintered colony to build up, or 10 weeks for a package. Those rules of thumb are based upon simple arithmetic.
Population Top Out
Question: What determines the maximum size to which a colony will grow?
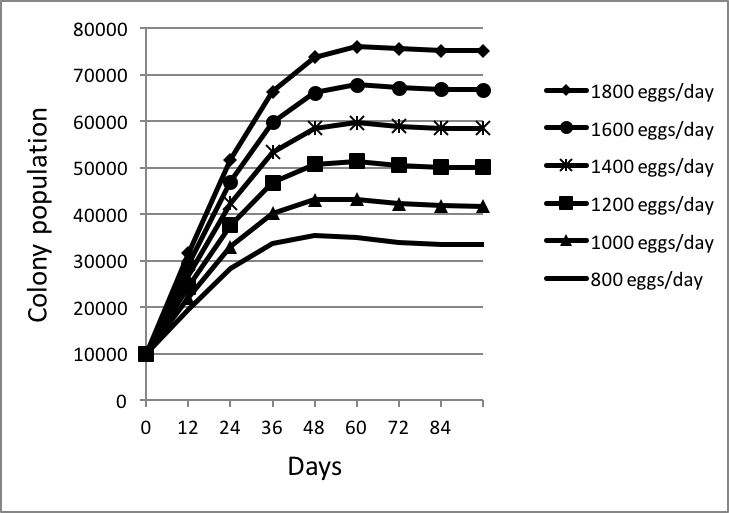
I then used my spreadsheet to calculate the ultimate equilibrium population reached at various rates of egglaying (Fig. 4):
Figure 4. I arbitrarily started each colony at 10,000 bees [[i]], with sealed brood emerging at the indicated rates of egglaying. Keep in mind that by 60 days, normal attrition would have caused the initial 10,000 adult bees to have dwindled to less than 600, thus having little influence on the overall colony population. Note that, at any egglaying rate, colonies reach an equilibrium maximum population at about 60 days after brood begins to emerge at the rate of the queen’s laying capacity.
[i] The size of the starting population makes no difference.
Conclusion: based upon Lloyd’s survivorship curve, which appears to be quite consistent from mid spring through late summer, a healthy, well fed colony will rapidly grow in about 60 days to its maximum size, which will be roughly 42x its daily recruitment (number of workers emerging per day). E.g., at an egglaying rate of 1000 per day, a colony will reach equilibrium at about 42,000 bees (which is consistent with measurements by a number of researchers).
Practical application: Poor nutrition or brood disease will reduce the percentage of the queen’s eggs that make it to adulthood, and nosema or extremely heavy foraging will reduce adult survivorship. Either factor will reduce the ultimate equilibrium size of the colony’s population (or prevent it from building altogether).
Playing Catch Up
Question: Then why can weak colonies sometimes catch up with those that got a head start?
Again and again I’ve seen some of the dinks that I leave behind when I move my strong colonies to almond pollination in early February, grow so rapidly in strength that they’ve caught up with the strong colonies by the time I bring them home several weeks later. And Russian or Carniolan bees, which overwinter with much smaller clusters than my Italians, often manage to explode their populations to match those of the Italians in time for the honey flow. But if population growth is linear, how can a weak colony catch up with a strong colony?
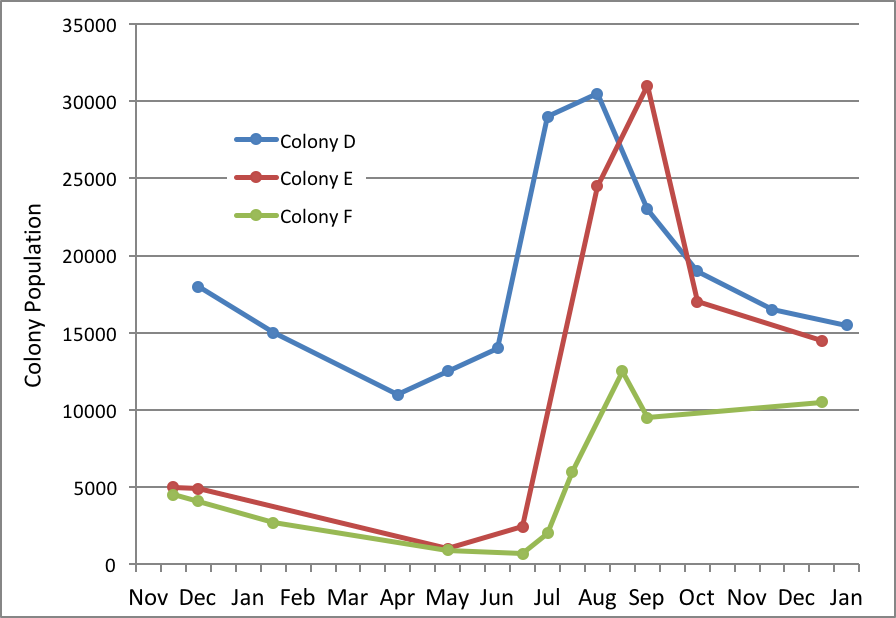
I’m hardly the first to ponder on this; Jeffree published a graph of the buildups of three colonies in Scotland in 1947 to illustrate the point [8](Fig. 5).
Figure 5. The year 1947 was exceptionally good for bees in Aberdeen, but not all colonies fared equally well. Note how all three colonies declined in late winter, pulled off successful spring turnovers, and grew linearly to their respective maximum strengths. However, only Colony D reached full strength in time to effectively take advantage of the main flow—producing 229 lbs of surplus honey. After Jeffrey [[i]].
[i] Jeffrey, EP (1959) Op cit, Figure 3.
Colony D came through the winter with a decent cluster size, pulled off a successful spring turnover in May, and reached a modest 30,000 bees (about 16 frames) in time to produce 229 lbs of surplus from the main honey flow. Colony E started tiny, yet still pulled off a successful spring turnover, catching up with D about 5 weeks later, and made 132 lbs (having missed hitting full strength in time for the main flow). On the other hand, poor little Colony F (690 individual bees at its low point) struggled with its spring turnover, and was unable to grow large enough to take advantage of the main honey flow (making only 28 lbs), but still reached an acceptable size for wintering by the end of the season.
So how the heck was Colony E able to catch up with D? The answer can again be explained by the math in Table 1 and by looking at the growth curves in Fig. 4. Once a colony establishes a broodnest large enough for a queen to hit her laying capacity, it indeed grows at a linear rate, but then slows way down at about 48 days. That slowdown causes colonies with head starts to lose their lead, allowing colonies s lagging slightly behind to catch up. Secondly, if a late-starting queen lays even 100 more eggs per day than an early starter, her colony will gain nearly 4000 bees more than the early starter over the next 48 days.
But lastly, if the colony is unable to complete a strong spring turnover early enough, it really misses the boat, and will be unable to grow strong in time for the main flow. Thus, colonies coming out of winter fairly strong at first spring pollen will generally have a leg up on weaker ones. But as anyone who has watched a hive of Russian bees explode in strength can confirm, some races of bees are adapted to later springs, and more rapid buildup.
Practical application: timing is everything. Unless the colony synchronizes its buildup to reach peak at the beginning of the main flow, it won’t be able to take full advantage of that honey flow. Our goal as beekeepers is to manage our colonies for such synchronization. If they are strong too early, they may swarm; and if too late, won’t be able to produce a surplus.
I’m acutely aware of this issue this season, since our local flora is flowering 2-4 weeks earlier than usual. We have a management plan based upon splitting our hives shortly after they return from almonds and have grown to the size that they are thinking of swarming. But this season, the forage that we depend upon for the buildup of our splits had already finished flowering before the colonies were ready to split. And now we’re facing the likelihood of an early main flow, followed by an abnormally long summer drought. We’ve been busting our butts trying to keep up.
Next
Causes of hiccups in colony buildup.
Acknowledgements
I again wish to express my gratitude to Lloyd Harris for sharing his data set. And of course to Peter Borst for his assistance in literature research. And there is no way that I could justify taking the time to research and write these articles without the generous donations by beekeepers to ScientificBeekeeping.com.
Citations and Footnotes
[1] Specifically, the amount of sealed brood, which underestimates the actual rate of egglaying.
[2] Borst, PL (2013) How long does a honey bee live? ABJ 153(3): 241-244.
[3] Woyke, J (1984) Correlations and interactions between population, length of worker life and honey production by honeybees in a temperate region. J. of Apic. Res. 23(3): 148-156.
[4] Sakagami, SF & H Fukuda (1968) Life tables for worker honeybees. Res. Popul, Ecol. X: 127-139.
[5] Harris, JL (2010) The effect of requeening in late July on honey bee colony development on the Northern Great Plains of North America after removal from an indoor winter storage facility. Journal of Apicultural Research and Bee World 49(2): 159-169.
[6] Actual worker survival from egg to larva is around 90% in unstressed colonies, so these figures actually underestimate the numbers of eggs laid by the queen. Fukuda, H. and Sakagami, S.F. 1968. Worker brood survival in honeybees. Res. Popul. Ecol. 10: 31-39.
[7] The size of the starting population makes no difference.
[8] Jeffree, EP (1959) The size of honey-bee colonies throughout the year and the best size to winter. A lecture given to the Central Association of Bee-Keepers
[9] Jeffrey, EP (1959) Op cit, Figure 3.
Tags: adult survivorship, colony buildup, colony decline, colony growth, egglaying


