A Test of Hopguard II As A Late-Summer Mite Treatment
A Test of Hopguard II As A Late-Summer Mite Treatment
Randy Oliver
ScientificBeekeeping.com
First published in ABJ in December 2014
Introduction
This summer my sons and I struggled with varroa in our operation; seems that we should have focused on mite control a couple of weeks earlier than usual. I kicked myself for allowing the mite to get a jump on us. But it seems that we were not the only ones—I’m hearing reports from all over of operations already crashing from mites.
I’m not yet clear how much the problem was simply due to others also not noticing early mite build up, or whether amitraz losing its effectiveness, but things are not looking good for the bee supply for almonds. I also suspect that we will be hearing about a lot of “CCD” this winter.
Practical application: Beekeepers should not become complacent about mite management. Varroa will inevitably develop resistance to any synthetic miticide applied in back-to-back, season-after-season treatments. Wise beekeepers will rotate miticides, and always have a fallback position.
Along that line, I was happy to see the manufacturer of the miticide HopguardÒ release an improved version: Hopguard IIÒ. Hopguard has a lot going for it as a varroacide:
- It’s a “natural” food grade product (hops beta acids).
- It appears to have no negative effects on normal hive activity.
- It leaves no residues in the honey.
- Typically only one application is required in a broodless hive.
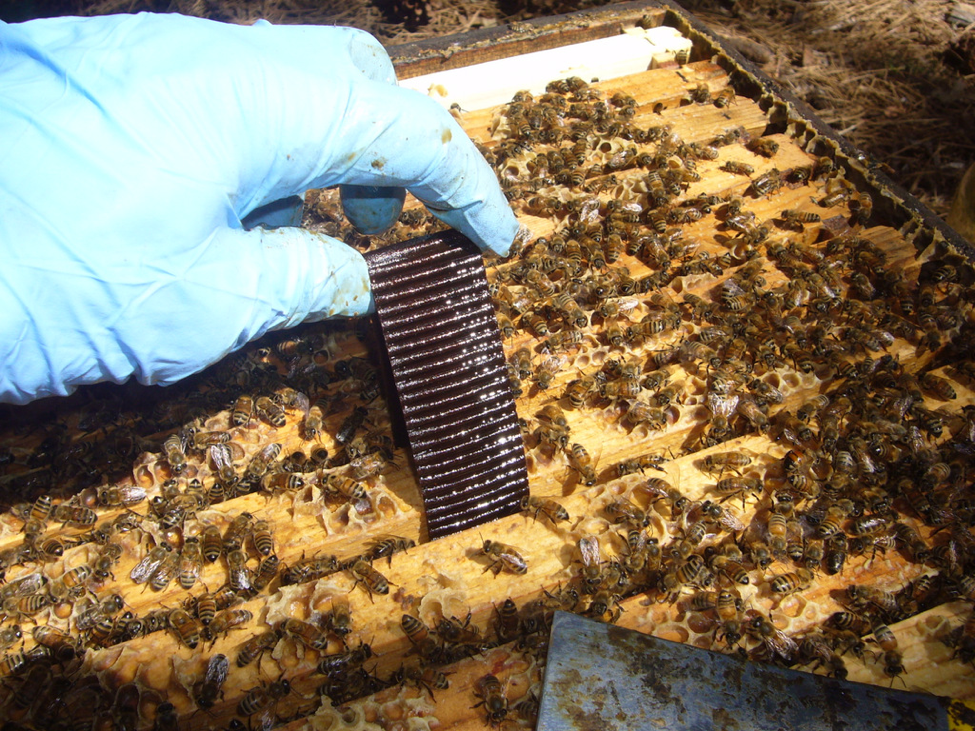
The new strips are made with a heavier and Mylar-reinforced corrugated cardboard (Fig. 1) that holds twice as much of the active ingredient as the previous formulation (~25 g vs. 12 g). When Medhat Nasr (Saskatchewan) and Fabiana Ahumada (Tucson ARS) independently tested the new formulation as fall treatments, the efficacy looked pretty danged impressive [1]; so the moment that the product received Section 18 registration in California, I started experimenting with it.
Figure 1. The new Hopguard II strips hold much more active ingredient, and release it over a longer period of time. But will it be useful for reducing mite levels in colonies full of brood?
The new formulation appeared to work quite well when I used it in another experiment to reduce mite levels in a group of nucs this spring. Although Hopguard is recommended for treatment during broodless periods, the manufacturer states that the new formulation increases the activity of the strip from 2-5 days to more than 12 days (which encompasses a full varroa in-brood reproductive cycle). That suggests that Hopguard II might also be useful even when brood is present. But when I later used it this summer to try to keep varroa in check in that ongoing experiment, mite levels started to creep up (a treatment with Apiguard® gel took care of them). So I decided to run a controlled trial to determine the actual efficacy of Hopguard II as a late-summer mite treatment while brood was present:
Experimental Design:
- Select varroa-infested colonies of various strengths.
- Arbitrarily assign hives to either the test group or an untreated control group.
- Treat the test colonies per mfr’s instructions at the rate of 1 Hopguard II strip per 5 frames of bees, using half strips if necessary to apply the exact recommended dose relative to actual colony strength.
- Feed all colonies pollen sub and sugar syrup to maintain broodrearing.
- Take starting and ending mite washes to determine the efficacy of the treatment.
Principal Investigator: Randy Oliver, assisted by Eric and Ian Oliver
Funding sources: Beekeeper contributions to ScientificBeekeeping.com, along with a portion of a grant from the North Dakota Department of Agriculture, solicited for me by the North Dakota Beekeepers Association.
Methods and Trial Log
Aug 29, 2014 We took initial alcohol washes from hives in a single yard to select 25 colonies with starting mite levels in excess of 5 mites per ½-cup sample of broodnest bees (>1.5% infestation). We were able to scrounge up 15 late nucs in singles and 10 established doubles, ranging in strength from 4 to 18 frames covered with bees. Initial mite levels ranged from 5-33 mites per ½-cup of bees. For each hive, we counted the number of frames covered with bees, and applied 1 strip of Hopguard II for every 5 frames of bees, distributed throughout the cluster, using half strips when colonies fell between 5-frame multiples (e.g., 1½ strips for an 8-frame colony). To stimulate continued broodrearing during our drought, we fed ½ gal undiluted sucrose/HFCS syrup and 1 patty of high-quality pollen sub.
Experimental considerations: Any experiment involving measuring varroa levels is best performed with colonies having high mite counts; otherwise there is not enough spread in the numbers in the data to clearly show the degree of effect (e.g., a change in count of 35 to 3 is far more instructive than a change of say, 3 to 1). The problem is that unless you just like to keep bees as mite fodder, you may not be able to find enough hives at a particular time with high enough infestation rates to run a meaningful experiment. We often need to take many dozens of mite washes from several yards to find enough colonies for a trial. For this trial, I intentionally left a number of hives untreated in order to allow their varroa populations to build.
And this then raises another problem for those of us who depend upon wintering strong colonies for almond contracts. We needed some untreated control colonies to determine the natural trajectory of mite buildup in the apiary (due to reproduction and drift). Technically, we should have chosen colonies over the full range of mite infestation rates, but we didn’t want to unnecessarily sacrifice colonies to mites this late in the season. So we chose the 3 singles and 2 doubles with lowest mite counts as the control group. This is the sort of practical trade off that I must make between running an ideal experiment, and my willingness to sacrifice colonies to the cause of the most scientific experimental design.
Sep 14 Colonies rearing brood due to supplemental feed. Fed another patty.
Sep 15 Took mite samples from all hives.
Sept 22 Since the mite levels from last week’s samples still remained higher than treatment threshold, I decided to apply a second round of Hopguard strips and extend the trial. We censored one hive in which the queen had been inadvertently killed during the previous sampling, and inserted fresh strips, again at the rate of 1 per 5 frames of bees, leaving the previous strips in place. We also open fed dry pollen sub to the yard to encourage broodrearing.
Oct 18 Took final mite counts.
Summary: Colonies had received strips at Days 0 and 24; final assessment of efficacy was at Day 50.
Practical tip: We use the following procedure to perform our mite counts: We remove a frame from the edge of the broodnest cluster and shake the bees into a white Rubbermaid dish tub. While we look to make sure that we haven’t inadvertently shaken the queen, we allow the older bees to fly off—leaving the younger bees that are more likely to be carrying mites. We then scoop up ½ cups of bees, carefully level it off, and dump them into a wide mouth pint Mason jar containing rubbing alcohol. Each jar is previously labeled with the date and hive number on a sticker on the lid. We then take the samples home for processing (Figs. 2 & 3).
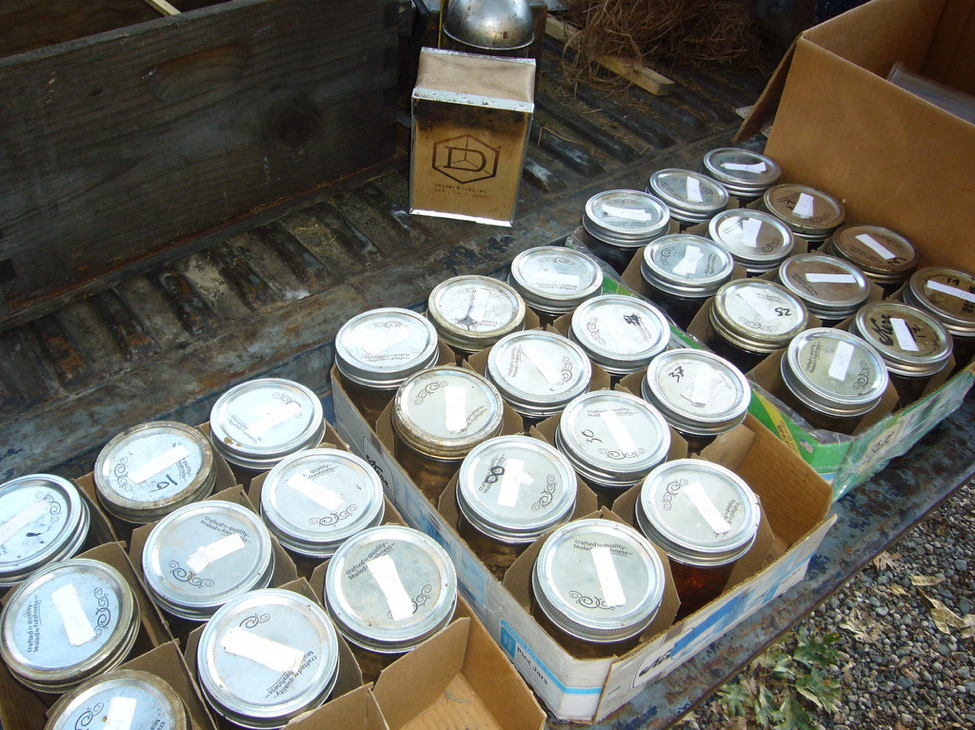 Figure 2. Jars of bee samples for alcohol-wash determination of varroa infestation rates. We find that the most efficient use of our time is to quickly take the samples in the outyards, and then mechanically wash them all when we get home. We do this throughout the year so that we always know the varroa level in our operation.
Scientific note: the most critical consideration while running field trials is to not make mistakes! One tiny screw up can ruin months’ work of hard work. Everyone involved must pay 100% attention to minute details, carefully label every hive and sample, double check everything as you do it, and keep meticulous and understandable notes and records of everything you do and observe.
I couldn’t run many of these studies and field trials without skilled and meticulous field assistance of my sons Eric and Ian, who question and double check every detail, and help with the tedious and hard labor of manipulating, treating, feeding, grading, and counting mites from often over 100 colonies in various experiments in any week of the year—all on top of running a commercial operation.
Figure 3. This high-tech homemade mite wash table agitates my preferred plastic mite wash cups [[i]] in perfect little circles, dropping every single mite within seconds. We rotate cups in and out without stopping the shaker, and can process samples very quickly (albeit tediously when mite counts are high).
[i] https://scientificbeekeeping.com/an-improved-but-not-yet-perfect-varroa-mite-washer/
Results
The first thing that we noticed is that the corrugated strips hold a lot of the sticky brown liquid. And if they are simply inserted between frames, some of the bees that they roll over get covered in the liquid and die (Fig. 4).
 Figure 4. Any unfortunate bees that get rolled under the Hopguard strips may get covered in the sticky liquid and later die. The bees also remove the brood behind the strip.
Practical application: You need to insert the Hopguard strips into the broodnest for best efficacy. But if you inadvertently hit a queen when you insert a strip, she’ll likely be killed. So we take the time to shake the bees off the frame before applying each strip. This is not a problem for those with only a few hives, but would add considerable labor expense to a commercial operation.
The next day we could see a handful of dead bees in front of each treated hive (luckily we didn’t find any dead queens) (Fig. 5).
 Figure 5. The typical amount of dead bees observed the next morning when we simply inserted strips without shaking the bees from the frame. This photo is from another experiment.
Colonies of bees vary greatly in their fastidiousness as far as removing foreign material from the hive (unfortunately, I’ve observed no correlation between the degree of this sort of housecleaning behavior and resistance to varroa). We noticed that some colonies would shred and carry out the Hopguard strips in a couple of days, whereas others would barely touch them (Fig. 6).
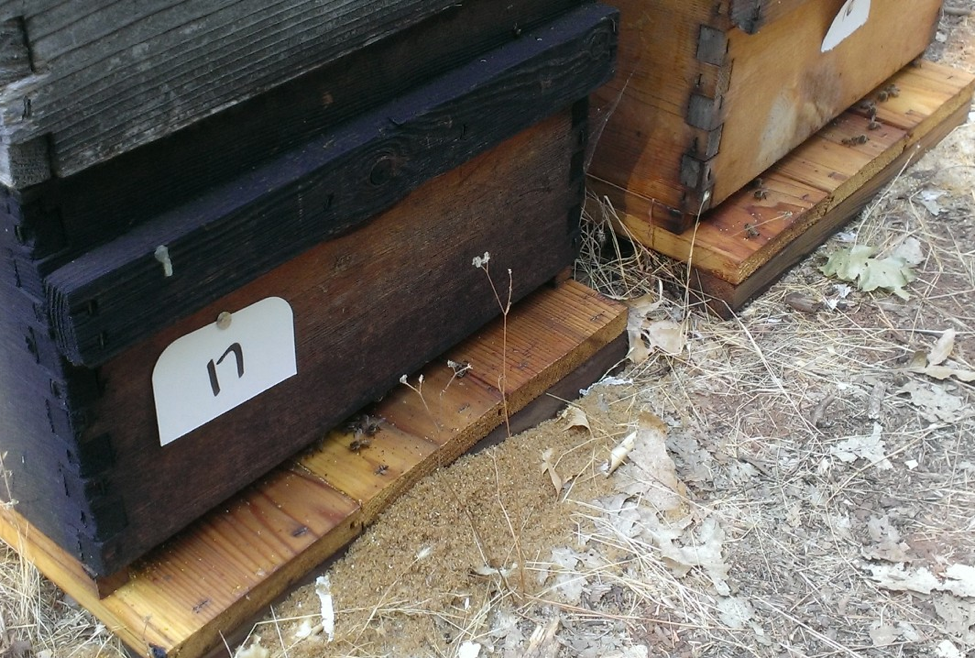 Figure 6. Two side-by-side colonies (from another experiment) headed by sister queens, each treated with Hopguard a couple of days previously. Note the difference in the amounts of shredded Hopguard debris in front of the landing boards.
The addition of the Mylar reinforcement in the strips leaves a piece of plastic that later requires hand removal (Fig. 7).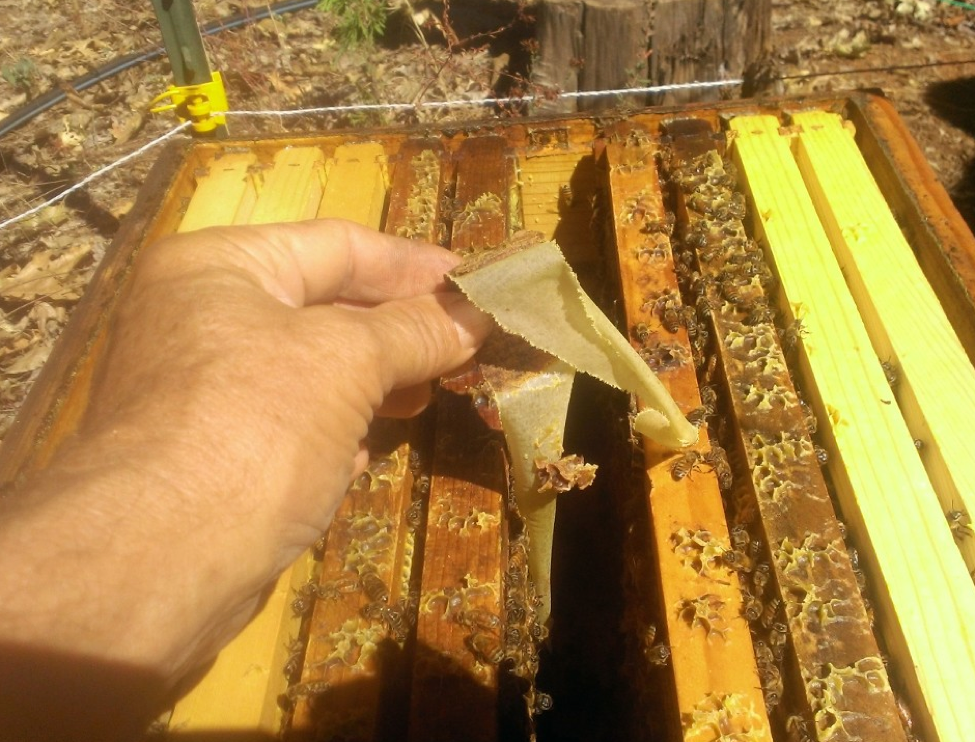
Figure 7. The few colonies that exhibited meticulous housecleaning behavior eventually stripped the cardboard from the Mylar backing. But most colonies left the strips largely intact for the duration of the trial.
By the end of the trial, the hives were chock full of strips (Fig. 8).
 Figure 8. This is a photo from Day 50. Some of the strips had been in for 50 days, some for 26 days. This lack of removal was more typical than that in the preceding photo.
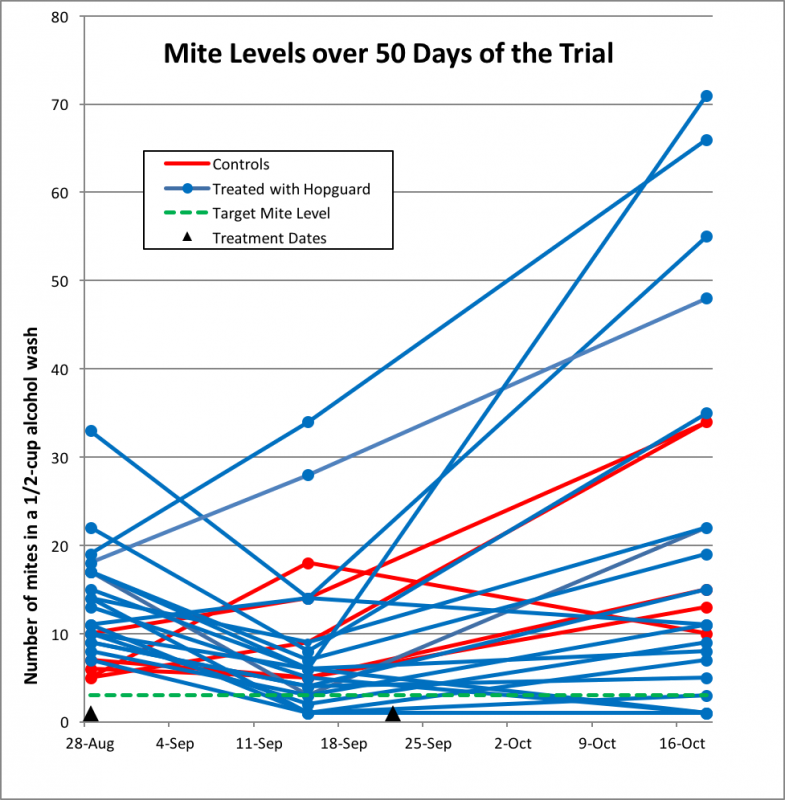
As expected, over the course of the trial, mite infestation rates rose in all the control colonies. Surprisingly, they also increased (in some cases substantially) in about half of the Hopguard II colonies, despite being twice treated. I’ve plotted the raw data in Figure 9.
Figure 9. Varroa increased at an expected rate in most of the control hives (red). Surprisingly, the mites exploded in a few of the Hopguard II hives (blue), despite being given two treatments. In only three of the 19 treated hives were mites brought below the target level (green broken line).
Scientific consideration: one has a choice of which kind of average to use in data analysis—the arithmetical mean, or the median value. With data such as these, the few outliers with sky-high mite counts tend to skew the mean value disproportionally upward. So for further analysis, I’ll use median values—the midpoints of each range.
I’ve shown the median mite counts for each group in Figure 10.
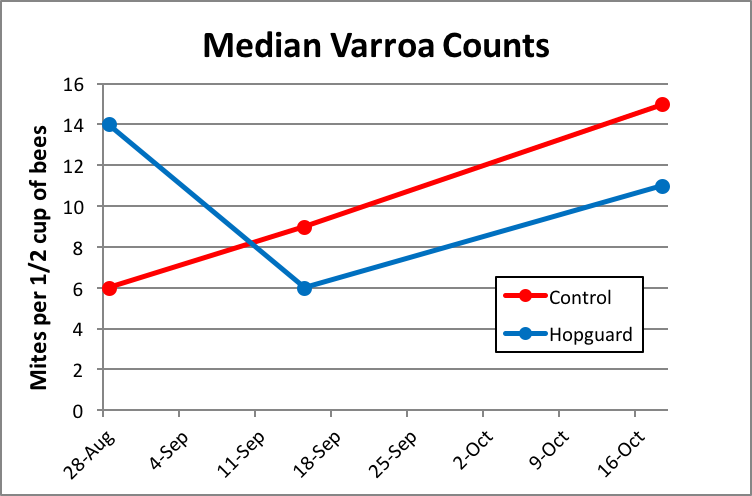 Figure 10. The control group started with lower mite levels, and the increase in infestation rate followed an expected trajectory, better than doubling over the course of the trial. In the test group, the first Hopguard II treatment appeared to have really knocked the mites back at 17 days, but the second treatment appeared to have little effect.
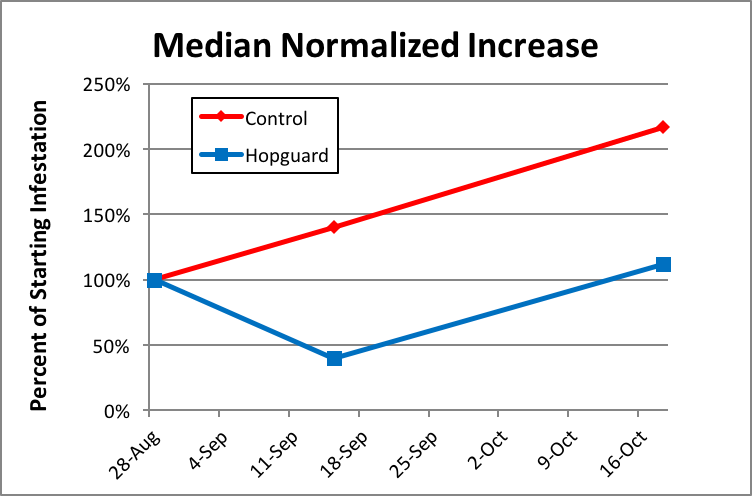
Scientific note: In order to compare rates of increase between two groups that start at different levels, we can divide the measurements taken at subsequent time points by the starting level to “normalize” the data for better comparison. In order to create the following chart, I normalized the mite wash counts for each hive by dividing them by the starting count for that hive (so that all counts start at 100%). The final value for the control group of 212% percent means that on average (median), mite counts slightly more than doubled from the starting levels.
The median normalized mite levels are shown in Figure 11.
Figure 11. In this graph we see that two treatments with Hopguard II in late summer just about held the mite infestation steady overall over the course of 50 days. Compared to the increase in the control group, the double treatment with Hopguard II reduced the overall rate of increase in mite infestation by about 50%—not bad, but not enough to reduce varroa counts to an acceptable level.
Discussion
A couple of curious results of this trial stand out. Take a look at figures 10 and 11. Why the heck was first application of Hopguard II so effective, but the second apparently ineffective? There was enough time between the first application and the midpoint mite count (17 days) for all the mites that had been hidden in the brood to emerge, yet the data suggest that varroa had still been knocked back by about 50%. Yet despite the fact that we applied a second set of strips shortly afterward, that treatment appeared to have no effect whatsoever on the progression of mite buildup by the end of the next 33 days (the slopes of mite increase are identical for both the treatment and control group). In retrospect, I wish that we had taken additional mite counts during that period of time, so that we could have more closely followed the progression of mite increase.
And then note in Figure 9 how the mite levels in a few of the colonies simply exploded despite being treated twice with Hopguard II. At first I suspected that this must have been due to mite immigration from collapsing colonies somewhere within flight range. But the steady increase in mite infestation in the control colonies over the entire duration of the trial (Fig. 10) suggests otherwise. I pondered on this for a while, and then it occurred to me to see whether there was any relationship between colony strength and the increase in mite infestation. There was—those four colonies in which mites went ballistic were some of the strongest colonies in the experiment. In order to see whether this was a general trend, it occurred to me to plot out mite counts vs. starting colony strength for all the treated hives (Fig. 12).
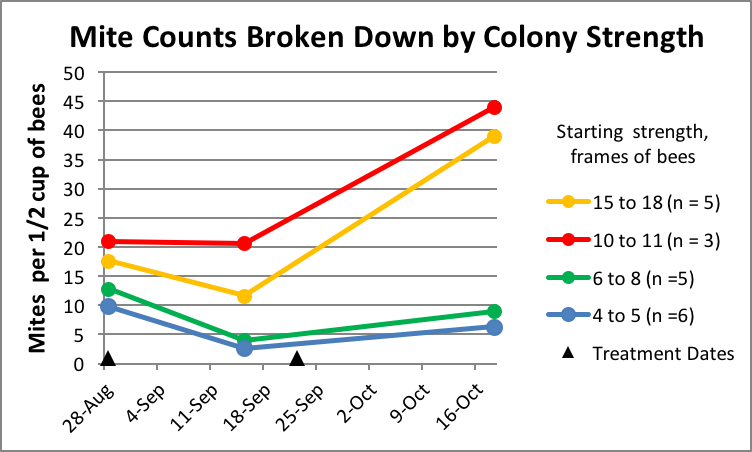 Figure 12. Lo and behold, there was clearly a relationship between colony strength and mite levels in the treated hives. The stronger colonies indeed started with somewhat higher counts (the smaller colonies had been late nucs), but note the strikingly greater rate of mite increase in the strong hives even after the second treatment.
Many of us have noticed that come fall it is often our strongest colonies that wind up with the highest mite levels. And in this trial one can clearly see that the differences in mite levels between weak and strong colonies grew even more pronounced in the last month of the trial. Why would this be—what difference would colony strength make? I can think of a few factors that could contribute to this observation:
- In general, strong colonies, having more brood, produce more mites than do weak colonies. And then as those strong colonies cut back on broodrearing in fall, the level of phoretic mites increases rapidly as the mite population moves from the brood to hitchhiking on adult bees. However, I’m not clear whether that was the case in this instance, since with the supplemental feeding, these colonies were not necessarily reducing broodrearing.
- Stronger colonies may be more likely to rob out (or attract drifting bees [3] from) other colonies collapsing from varroa, and thus suffer from “mite immigration.” Again, I’m not sure whether this was the case, since I have no idea as to whether there were collapsing colonies within flight range, nor was this pattern evident in the five control hives (not shown).
- Or maybe, despite us applying Hopguard proportionally to colony strength, it was for some reason more efficacious in the 4-8 frame colonies.
Practical application: Although I can’t fully explain some of the findings of this trial, let’s return to the hypothesis being tested: can late-season treatment with Hopguard II be effectively used to reduce varroa levels to acceptable levels?
I had hoped that the extended release rate of the new Hopguard formulation might have made it a useful treatment in late summer even when colonies contained brood, but it does not appear to fit that bill. There was some knockback at 17 days (more so in the weaker colonies), but surprisingly little long-term effect, despite as second application.
That said, Hopguard II remains a fine product for mite control in colonies without brood, in newly-hived swarms, or for package bees (an oxalic acid dribble is another option for broodless bees). It may also be effective for a quick knockback of mites in a hive from which you have not yet pulled the honey (Mite Away Quick StripsÒ are another, and more effective, option at that time). I hope that the manufacturer continues to improve the product, since hops beta acids clearly have great potential as a varroacide. But in its current form, I wouldn’t recommend it for late-season treatment until most of the brood has emerged.
Acknowledgements
I wish to thank those beekeepers who have generously donated to support my research, especially the North Dakota Beekeepers Association.
References and Notes
[1] http://wasba.org/hopguard-hop-beta-acids-section-18-use-approved/
[2] https://scientificbeekeeping.com/an-improved-but-not-yet-perfect-varroa-mite-washer/
[3] A very interesting recent study found that as mite levels in a colony increase, the phoretic mites tend to start hitchhiking on older bees (such as foragers) as well as on the nurses, due to a change in the chemical profiles of the bees. It’s not yet clear whether this helps the mites in catching rides to other hives.
Cervo, R, et al (2014) High Varroa mite abundance influences chemical profiles of worker bees and mite–host preferences. The Journal of Experimental Biology 2998-3001.


