Mite Management Update 2013
Frame-to-Frame Consistency of Samples
Mite Recovery of the Alcohol Wash
Natural Mite Drop vs. Alcohol Wash
Experimenting with MAQS Strips
Mite Management Update 2013
First published in ABJ August 2013
It’s that time of year again to get a jump on varroa mites before it’s too late. This raises two questions: how to measure the degree of mite infestation in your hives, and how to treat if the levels are excessive. In this article I’ll share some of what I’ve learned in the past year.
It’s common consensus that if the mite infestation rate (the percentage of bees actually parasitized by a mite) is kept low, that the colony can generally deal with the “varroa/virus complex.” It is only when that infestation rate exceeds some “economic threshold” that the combination of the direct damage due to varroa parasitism, combined with the mite’s vectoring of viruses within the hive, create the explosive virus epidemics that cause noticeable colony morbidity or mortality.
For my apiaries in the California foothills, I’ve found that if I keep the mite infestation rate below the 2% level (2 mites per 100 bees) that my colonies thrive. But should that rate reach 5%, then I start seeing the brood fall apart. By the time the rate reaches 15%, the colony is generally seriously on the way downhill, and even with treatment may not recover.
The most critical time to monitor and reduce the mite level is in late summer and fall, since this is when the generation of bees that form the winter cluster is raised. If there is a virus epidemic in the hive in fall, the colony will likely not survive the winter.
Surprisingly, many beekeepers allow their apiaries to enter the winter with excessive mite loads (Fig. 1).
Figure 1. Data from samples from cooperating beekeepers across the country indicate that mite levels in many apiaries exceed the economic treatment threshold in fall. Note that in 2010 the average sampled hive contained nearly 10 mites per 100 bees in November! It is not surprising that such colonies suffer from elevated winter mortality. Graph from [[i]].
[i] http://www.aphis.usda.gov/plant_health/plant_pest_info/honey_bees/downloads/2011_National_Survey_Report.pdf
Last year I ran some trials in which I was required to withhold mite treatments. I do not yet have the data from one trial in which 70% of the colonies died, but those results should help us greatly in understanding the dynamics of the varroa/virus complex.
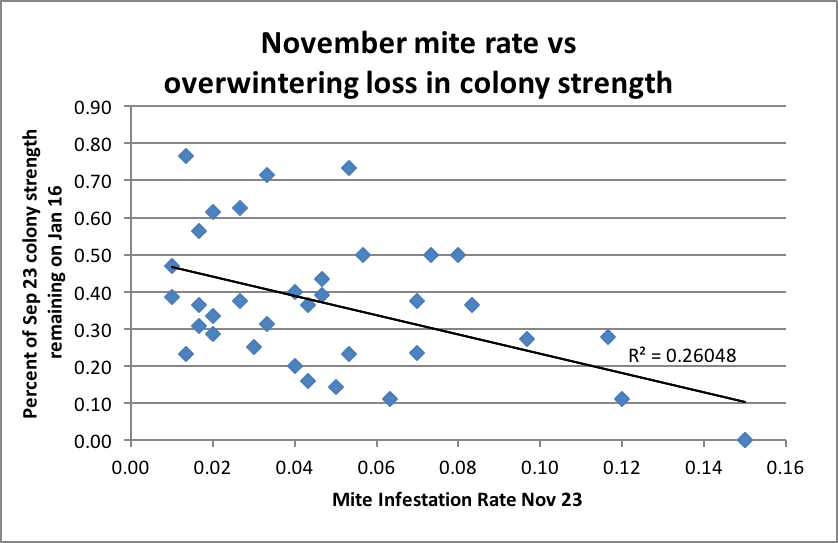
But I do have some data to share from a smaller trial in which I measured mite levels and colony frame strength over the course of the winter (Fig. 2).
Figure 2. For these 36 colonies, there was a clear relationship between November mite levels and loss of colony strength over winter. The mean starting strength was 9.2 frames covered with bees (range 6.5-13) on Sept. 12.
Monitoring Mites by Sampling
So how does one determine what the actual infestation rate of a colony is? The only definitive assessment is to kill all the bees in the hive, wash all the mites from them, and then count all the bees and mites one by one. And then, you’d need to open all the sealed brood and count the mites in each cell. Obviously, Joe Beekeeper is not going to do that!
So we generally use either:
- An indirect method of sampling, such as natural mite drop.
- A more direct whole-hive method such as drop accelerated by sugar dust or chemical treatment.
- A direct counting of the number of mites in a sample of adult bees or in worker or brood cells.
All the above methods are detailed at my website.
I’ve found the sampling of drone brood to be totally unreliable, and no beekeeper that I know is going to open hundreds of worker cells to count mites. The accelerated drop method works well, but it requires a screened bottom board, two trips to the hive, and must be adjusted for the number of frames actually covered by bees.
So that leaves as the most practical methods, the natural mite drop onto sticky boards, or one of the “jar” methods—ether roll, alcohol or detergent wash, or the “sugar shake.” I tend to favor the jar methods, since they are quick, require only one trip to the hive, are direct rather than indirect methods, and do not require adjustment for the strength of the colony.
The other reason that I favor the direct methods of sampling is that they reflect the actual biological relevance of the mite infestation. The percentage of bees that are carrying a mite is more relevant to the immune suppression and virus transmission by the mite than is the rate at which mites are falling from the combs on any particular day. Direct measurement also does not need to be adjusted for colony strength.
Although many commercial beekeepers favor the ether roll, I found it to be inconsistent. That leaves the alcohol and detergent washes and the sugar shake, which give roughly the same results. The alcohol is also handy because it will preserve bees for later sampling for nosema, or at a wash table back at the shop. On the other hand, the sugar shake does not require the killing of any bees, but does take a strong arm if you plan to do more than a few tests.
So allow me to now compare the alcohol wash and the natural drop methods. First, let me check our assumptions for the validity of the sampling and the wash.
Frame-to-Frame Consistency of Samples
Dr. Frank Eischen of the U.S. ARS was kind enough to share with me a data set from 2005 in which he had counted the numbers of bees and mites in samples of bees shaken from two different frames from the brood nest of each hive. I took the 168 paired samples [2], which averaged 512 bees per sample, and determined the difference in the mite infestation rates between the samples. The mean mite infestation was 6 mites per 100 bees (6% infestation rate), ranging from zero to 58/100 (Fig. 3).
Figure 3. Frequency distribution of the differences in mites/100 bees in samples taken from two different frames from the broodnest of a hive. In 85% of the cases, the count was within 3 mites/100 bees. Data originally from Dr. Frank Eischen.
The above data suggest that there is not a great deal of frame-to-frame variation in the mite infestation rate of house bees (my own limited data suggest the same). Since I use a treatment threshold of 2 mites/100 bees, I checked the 54 cases in which a colony tested at 2 or fewer mites/100 in the first sample. In only three cases out of those 54 did the second frame contain of more than 5 mites/100 bees.
Practical applications: any frame from the broodnest appears to be adequate for sampling. At low infestation rates, any sample is unlikely to underestimate a serious infestation. I tend to pull an outer brood frame in order to minimize the chance of disturbing or inadvertently killing the queen. So long as you consistently pull a frame from the same area of the broodnest, you can then compare consistent samples.
Mite Recovery of the Alcohol Wash
The question to me then is how well the “Mite Wash” bottle developed by Dr. Medhat Nasr (Fig.4) actually recovered the mites on the bees. So I shook a bunch of samples of bees three times in a row to eventually recover all the mites. I shook at a rate of about three shakes per count, for the count of twenty, for a total of about 60 shakes. I shook vigorously enough to dislodge stingers from the bees (Fig. 5). At the end of each shaking I jiggled the bottle to keep the mites from being caught in the bees as the alcohol drained to the lower jar (see [3] for details on the method).
Figure 4. Using the mite wash bottle. When I’m really cooking, I can sample hives at a turnaround time of less than four minutes per hive.
Figure 5. Mites are easy to see and quickly count in the Mite Wash bottle. Note the presence of the dislodged stinger at lower right, which is a good indicator for whether you are shaking vigorously enough. The 21 mites in this sample of ½ cup of bees would indicate an infestation rate in the ballpark of 7 mites/100 bees (7% rate). This is far above my treatment threshold.
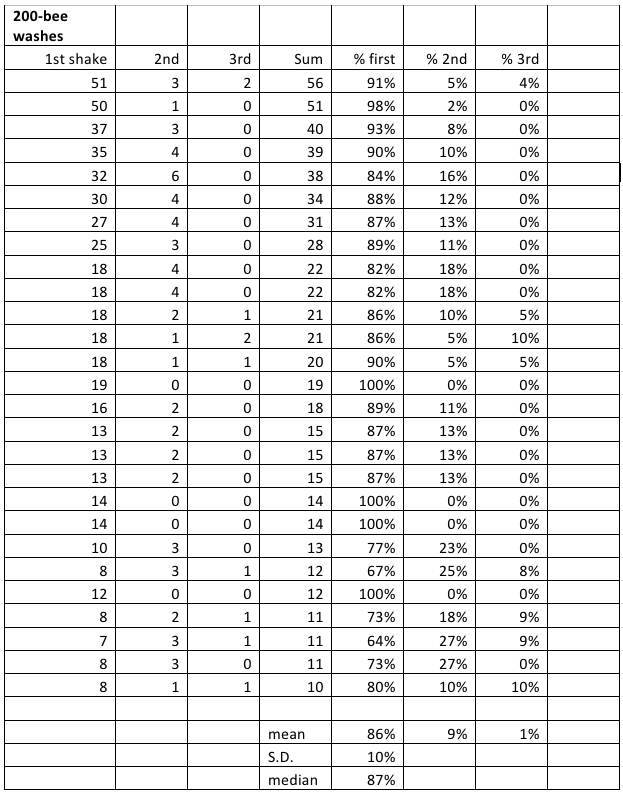
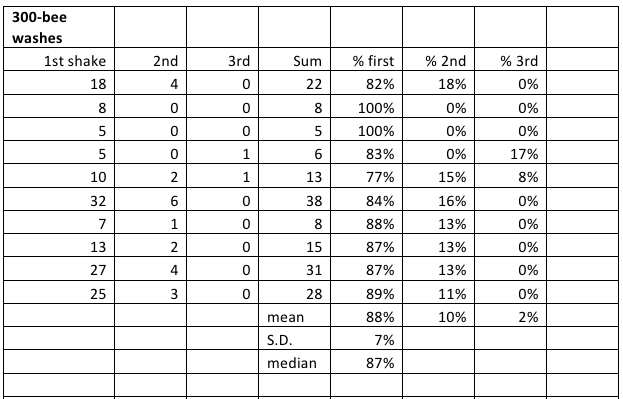
Table 1. Recovery of mites by alcohol wash in a “Mite Wash” bottle. I averaged 87% recovery in the first wash.
You can see that determining the mite infestation rate of a colony has a certain amount of built in error. There is frame-to-frame variability, variation in the number of bees in the sample cup, and variation in the recovery rate of mites. However, it appears to me that the washing the mites from a sample of bees from the broodnest gives a pretty good ballpark representation of actual mite infestation rates. I would certainly not trust any individual sample. But in practical experience, I find that a second shake from the same colony generally comes up within a mite or two at low infestation rates. Please note that one need not fabricate a Mite Wash bottle to perform an alcohol wash—a kitchen sieve in a bowl also works just fine!
Sticky Boards
Lots of beekeepers use stickyboards because they don’t have to open the hive, which is a plus. But if you’re over 40, then you’ve got to deal with the fact that it’s danged hard and dismally tedious to discriminate the mites from the hive trash, and then keep a running total of counted mites without either missing some or counting others twice (Fig. 6). In addition, sticky board counts still must be adjusted not only for colony strength, but also for the time of year and amount of brood present in order to see how they relate to the threshold for treatment [4].
Figure 6. Counting mites among the hive trash on a sticky board is a tedious process that requires sharp eyes or supplementary magnification. The natural mite drop is an indirect indicator of the mite infestation rate, since the count is largely dependent upon the amount of brood emergence on that day. This portion of the sticky board shows five adult mites clearly, one adult partially hidden by a piece of hive trash, and one partial mite shell.
But what I really I wondered was just how consistently the natural mite drop reflected the actual infestation rate of the adult bees in the hive?
I had the opportunity last summer to run a trial in which I took sticky board counts of natural mite fall as well as alcohol washes from the same hives sometimes on the same days over a period of time. I was immediately surprised by the large day-to-day variation in natural mite drop, and wondered whether it had anything to do with temperature, humidity, or rain, so I downloaded the records of the local weather station. Below are the average daily mite drop counts for 12 hives over the course of 10 days, recording the average and maximum temperature for the day, minimum humidity, and whether it rained (Fig. 7).
Figure 7. Mean daily mite drop for 10 hives relative to environmental factors. There was rain in the apiary on 5 August. Although temperature and humidity varied a fair amount, I don’t see any particular relationship between environmental factors and natural mite drop.
Note that in the above graph that the mite levels went up and down considerably from day to day, which was surprising, since I think that it’s safe to assume that the mite infestation rate of the apiary did not vary that much on a daily basis. This raised the question in my mind as to how consistent the counts were for each individual hive, which would tell me how much I could trust any single count. I’ve plotted the data below (Fig. 8).
Figure 8. Sticky board counts for six hives over time. Note that on any particular day, the count can easily go up or down by a factor of two!
Clearly, natural mite drop is highly variable from day to day. So I wondered whether the same would apply to an alcohol wash.
Natural Mite Drop vs. Alcohol Wash
As luck would have it, I had also collected data or alcohol washes of ½ cup of bees from the same colonies, sometimes on the same days that I took sticky board counts (Fig. 9).
Figure 9. Alcohol washes for the same hives overlapping the dates of the preceding graph. Note a couple of things: the reduced variability of alcohol washes, and that the plots of the two methods for determining mite infestation rate do not match for each colony (the color for each hive is matched in the two charts).
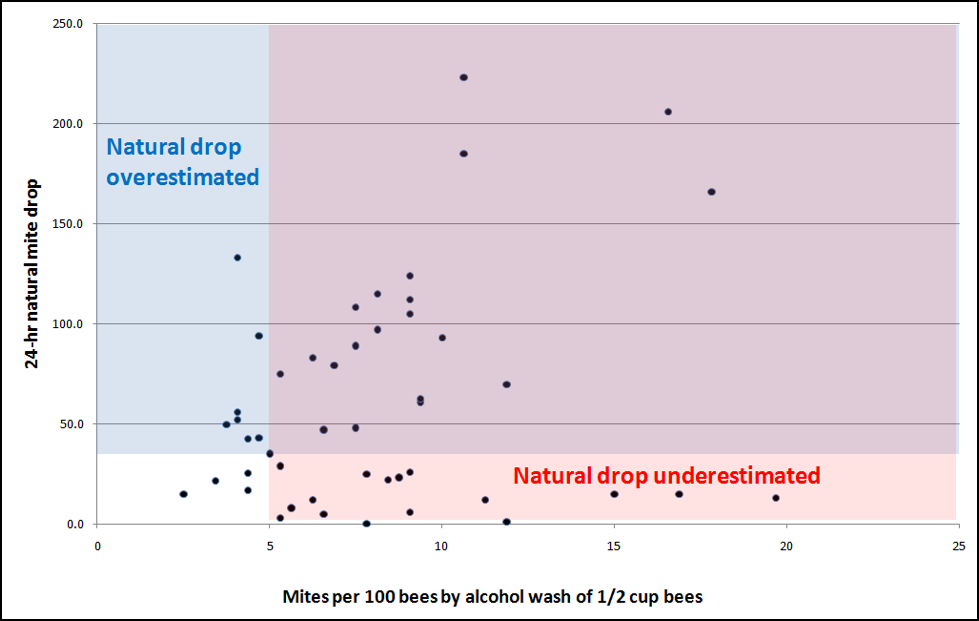
From a practical standpoint, the most important question is which method most closely reflects the actual infestation rate in the hive. Since the alcohol wash is a direct measurement of the actual number of mites per 100 bees, it would likely have the most biological (and practical) relevance. So let’s compare the two for my full [5] data set (Fig. 10).
Figure 10. Comparisons of natural mite drops on sticky boards to alcohol wash of ½ cup of bees, late July and early August. The alarming thing is those natural drop counts in the pink shaded area at the bottom, in which natural mite drop substantially underestimated a serious infestation rate in the hive (more than 5 mites/100 bees). Of less concern were those stickyboard counts in the blue area, which overestimated the problem.
As you can see above, the two monitoring methods followed the same general trend—natural mite fall tended to go up as the actual mite infestation rate rose. The problem is that in a fair percentage of the cases, natural drop did not reflect the brewing of a serious mite infestation!
Practical application: I’ve lost faith in the natural mite drop as a means of monitoring mite levels. It is handy when used to determine whether a miticide gives a quick knock down, but not so much to indicate the biologically relevant level of mite infestation. If one does use stickyboards as their only monitoring method, might I suggest that you take counts over a period of time.
Discussion
Beekeepers and researchers have long looked for an easy, consistent, and accurate method of estimating the mite infestation rate within a hive [[i]]. Each method has advantages and drawbacks. Whole-hive sampling methods (natural drop, accelerated drop) are more likely to detect mites at low infestation rates, since the entire hive population is sampled. But at higher infestation rates, the consistency of the natural mite drop appears to fall apart (perhaps because of the number of variables involved). The difference between the natural drop and the accelerated drop is that the first is an indirect measurement, whereas with a high-efficacy accelerant, the other is more of a direct method.
The “jar” techniques of removing mites from a sample of 200-400 bees from the broodnest are all direct methods, and all appear to be consistently reliable. I tend to favor these methods since they only require one trip to the hive, don’t require sharp eyes and excessive counting, and the results give the beekeeper a true indication of the degree of mite stress to the bees in the broodnest.
I don’t have strong feelings for or against any of the jar methods. Sugar shake resonates with hobbyists, since the method doesn’t require the killing of any bees, but it does take more shaking, and in my tests mite recovery was less than that of the wash methods. I was disappointed in my early testing of the ether roll, but since it is commonly (and apparently successfully) used by many commercial beekeepers, perhaps I was premature in my dismissal of it as a reliable method.
The wash methods (alcohol or detergent) work quite well, with alcohol being a bit less messy. The Nasr mite wash bottle is a handy field tool, but still leaves something to be desired, since its design tends to allow mites to be trapped in the bees as the alcohol washes down, depressing the recovery rate. This defect can be corrected with a shaker table, in which alcohol-immersed bees are always held above the bottom of the container by a screen (personal experience). I hope to further experiment in improving methods for performing the alcohol wash in the field, perhaps building upon an original design for a wash bottle that I published in 2006 [7].
Experimenting with MAQS Strips
My three favorite mite treatments are now thymol (applied as Apiguard thymol gel), oxalic acid (applied as a dribble), and formic acid (applied in Mite Away Quick Strips–MAQS). I’m quite taken by MAQS, since it is effective, can be applied with honey supers on, and leaves no residues in the hive. As with any new product, there is a learning curve. So let me share some of the results of my own experimentation.
In the first place, after hearing of beekeepers who suffered queen loss issues after applying the full two-strip (“knockout”) treatment, I’ve only applied single strips to a hive (“knockback”), and haven’t noticed any queen issues (I’m curious now as to whether some of those beekeepers inadvertently tore the slow-release paper on the strips, which can result in an excessive initial spike in formic vapors).
Last summer I experimented with testing the efficacy of both single-strip and half-strip applications. All applications were made between late August and late September during dry 90°F weather (Fig. 11). The mite infestation rate was measured by alcohol wash of 1/2 cup of bees for the 22 August data, and from1/3 cup of bees at the other time points. I took mite measurements at time of treatment, again at 16-20 days, and in some cases at 35 days after treatment. Measurements at those time intervals (roughly after one or two mite reproductive cycles) were timed in order to pick up the effect that formic treatment might have on the male mites under the cappings. All applications were to double deep strong colonies with ¾” entrances unless otherwise noted. The strips were laid crosswise between the brood chambers.
Figure 11. Temperatures during the tests.
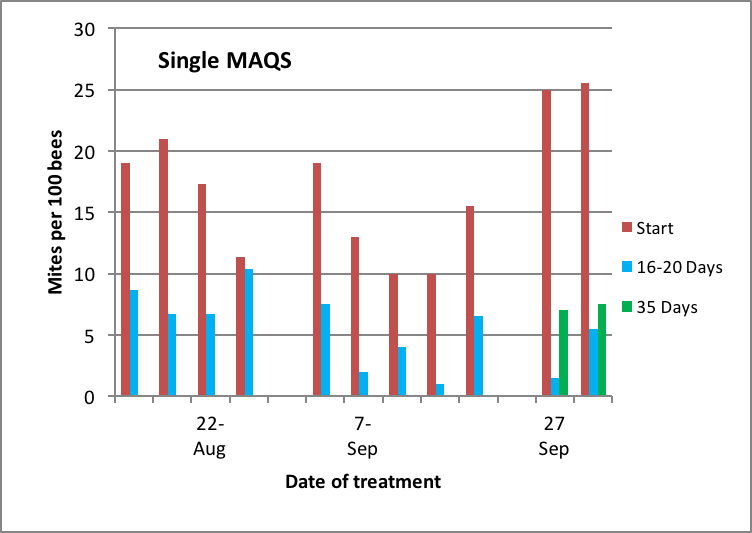
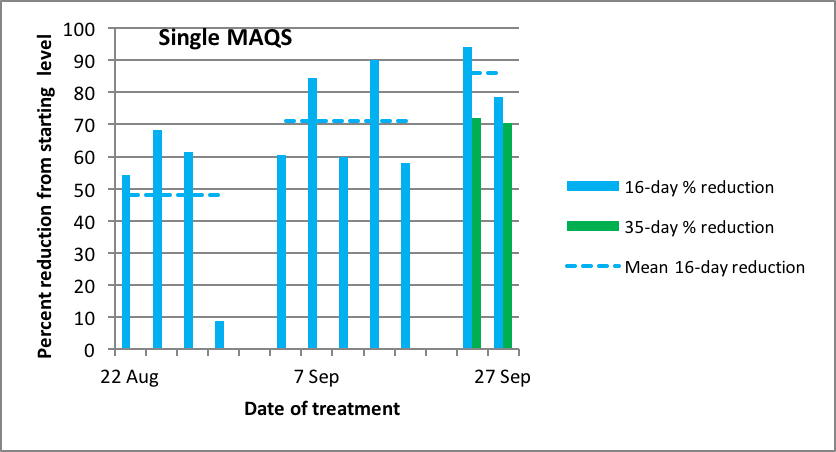
The results of my testing of a single MAQS follow (Figs. 12 & 13):
Figure 12. Mites levels in highly-infested hives late in the season at time of treatment and at intervals thereafter. Red bars are initial mite levels, blue and green bars represent mite levels after one or two mite reproductive cycles, respectively. Note the greater degree of mite reduction by the treatment in the later-applied treatments. I apologize for not having data for control colonies [[i]].
[i] In order to run a truly valid test of efficacy, one would need to simultaneously measure the mite levels in adjacent untreated control hives, to see whether mite levels would have dropped off spontaneously. I apologize for not having such data. My pitiful excuse is that I initially set up the trial with controls and took mite washes, but midway into taking the 16-day checkback samples, I suddenly realized that I needed to get to the airport for a conference, s0 skipped taking samples from the control group. I missed the flight anyway : (
As a beekeeper, however, I know that the mite levels of the rest of the colonies in my operation typically continue to rise at this time of year, so although I would not be able to publish this data in a refereed journal, I feel that it may be of value to beekeepers whose goal is simply to get below a target infestation rate.
Figure 13. The same data as above, but normalized to indicate the percentage reduction from initial mite level. Note that the efficacy increased at later treatment dates (up to 90%), presumably due to the colonies reducing the amount of brood present as they settled down in our dry fall weather.
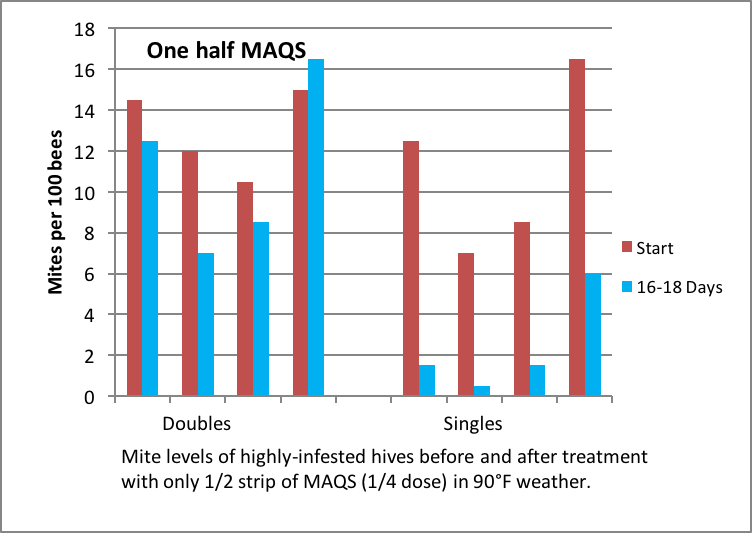
Since in my mite management strategy we only look for a 50-60% mite knockback with treatments (to make the treatments easier on the bees, and to avoid mite resistance to the treatments), we’ve been quite happy with the efficacy of a single strip of MAQS. The question then was, how effective would a half strip be? So I applied a half of a single strip to doubles and recently-started singles (~6-frame strength) (Figs. 14 & 15).
Figure 14. Half of one MAQS didn’t do much good in a double, but was remarkably effective in small singles in hot weather.
Figure 15. Same as before; note the high efficacy of a half strip in weak singles.
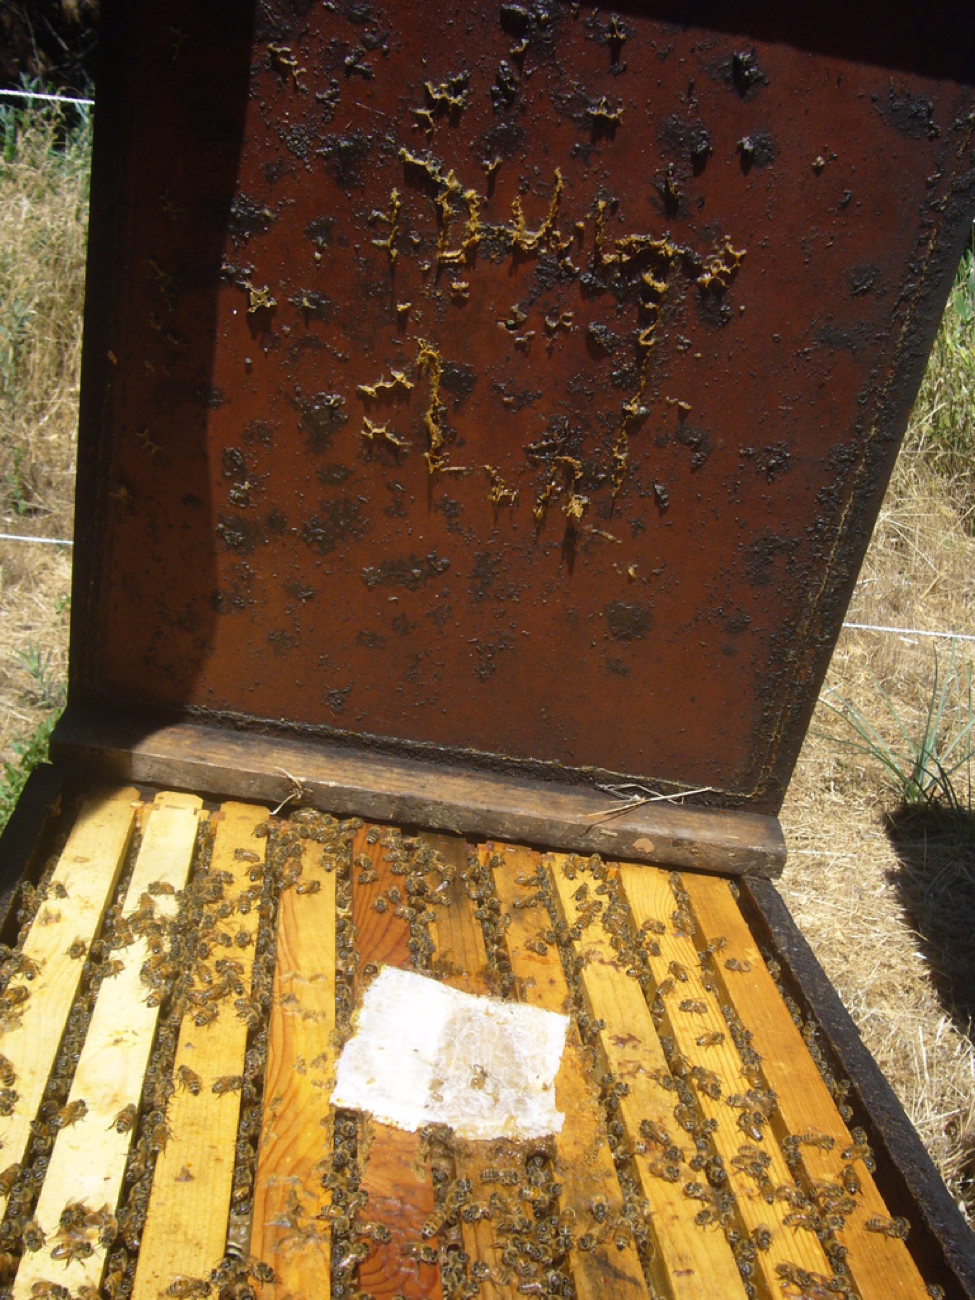
The undersides of the hive covers of those weak singles get quite warm—I measured inside temperatures exceeding 130°F on the wood against which the half MAQS was pressed. I fully expected that such temperatures would rapidly evaporate the formic vapors out of the gel. I was surprised to find that even two weeks after application, the strips remained soft and intensely redolent of formic –unlike those between brood chambers, which quickly dry and harden. I suspect that this is due to at least three factors—the lid sealing off the top surface of the strip from evaporation, the bees sealing the four edges of the strip with propolis (Fig. 16), and the bees’ behavior of placing drops of water on the top bars for evaporative cooling in hot weather.
For whatever reasons, such reduction and prolongation of the formic acid evaporation may have helped in reducing queen loss, and perhaps the efficacy of mite kill. We treated a couple of dozen weak singles, and only observed queen supersedure in two that had queens with preexisting problems.
Figure 16. A half of a MAQS applied directly under a dark lid to a strong single during 90°F weather.
References and Footnotes
[2] I censored one clear outlier.
[3] https://scientificbeekeeping.com/sick-bees-part-11-mite-monitoring-methods/
[4] https://secure.fera.defra.gov.uk/beebase/public/BeeDiseases/varroaCalculator.cfm
[5] The trial from which I took this data was for a bee health product that was applied to the colonies mid trial (it had a minimal effect on mite drop for a few days). I didn’t want that effect to influence the plots over time, so I only used the data from the control hives for the first graphs. But for comparing the two methods of sampling, I could use the full data set, since for each data point I was only comparing the actual mite presence in each hive at that moment in time.
[6] Various researchers have compared sampling methods. A review of the research through the year 2000 can be found in :
Devlin, SM (2001) Comparative analyses of sampling methods for varroa mites (Varroa destructor Anderson and Trueman) on honey bees (Apis mellifera L.). M.S. Thesis, Simon Fraser University.
More recently, Dr. Pierre Giovanazzo has presented data at conferences that suggested that natural mite drop was more indicative than alcohol wash.
However, data from Dr. Rob Currie indicate that alcohol wash accurately reflects the buildup of the mite infestation rate over the course of the year. http://capabees.org/content/uploads/2013/02/varroathreshold.pdf
[7] https://scientificbeekeeping.com/fighting-varroa-reconnaissance-mite-sampling/
[8] In order to run a truly valid test of efficacy, one would need to simultaneously measure the mite levels in adjacent untreated control hives, to see whether mite levels would have dropped off spontaneously. I apologize for not having such data. My pitiful excuse is that I initially set up the trial with controls and took mite washes, but midway into taking the 16-day checkback samples, I suddenly realized that I needed to get to the airport for a conference, s0 skipped taking samples from the control group. I missed the flight anyway : (
As a beekeeper, however, I know that the mite levels of the rest of the colonies in my operation typically continue to rise at this time of year, so although I would not be able to publish this data in a refereed journal, I feel that it may be of value to beekeepers whose goal is simply to get below a target infestation rate.


